本文为Prometheus的入门级安装教程,主要用于搭建一个Prometheus入门级的demo环境,便于小白用户使用,大神可忽略。
基本信息
系统环境
本文档所指安装过程是基于CentOS 7(CentOS-7-x86_64-DVD-1511.iso)操作系统。
硬件环境:ESXi上的虚拟机:4核CPU、8G内存,100G硬盘。
安装docker
使用容器方式安装Prometheus组件就需要先安装docker服务 ,如果使用二进制包安装Prometheus组件可忽略本节。
sudo yum install -y yum-utils \
  device-mapper-persistent-data \
  lvm2
sudo yum-config-manager \
    --add-repo \
    https://download.docker.com/linux/centos/docker-ce.repo
sudo yum-config-manager --enable docker-ce-nightly
sudo yum install docker-ce docker-ce-cli containerd.io
[root@zht-prometheus ~]# yum list docker-ce --showduplicates | sort -r
 * updates: mirrors.tuna.tsinghua.edu.cn
Loading mirror speeds from cached hostfile
Loaded plugins: fastestmirror, langpacks
Installed Packages
 * extras: mirrors.163.com
docker-ce.x86_64    3:19.03.2-3.el7                            docker-ce-stable
docker-ce.x86_64    3:19.03.2-3.el7                            @docker-ce-stable
docker-ce.x86_64    3:19.03.1-3.el7                            docker-ce-stable
docker-ce.x86_64    3:19.03.0-3.el7                            docker-ce-stable
docker-ce.x86_64    3:18.09.9-3.el7                            docker-ce-stable
...
sudo yum install docker-ce-19.03.2 docker-ce-cli-19.03.2 containerd.io
sudo systemctl start docker.service
sudo systemctl enable docker.service
sudo docker run hello-world
参考链接:https://docs.docker.com/install/linux/docker-ce/centos/
安装Golang
wget https://dl.google.com/go/go1.13.linux-amd64.tar.gz
tar -C /usr/local -xzf go1.13.linux-amd64.tar.gz
在/etc/profile文件末尾添加export PATH=$PATH:/usr/local/go/bin
source /etc/profile
Docker方式安装Prometheus组件
本章节主要介绍使用docker容器安装Prometheus的各个组件,但由于Prometheus的各个组件之间需要通过RestFul API进行通信,或者需要通过AlertManager向外部发送告警信息,会出现网络各种不通的情况。
安装Prometheus Server(Docker方式)
mkdir -p /home/zht/prometheus/server/
mkdir -p /home/zht/prometheus/client/
touch /home/zht/prometheus/server/rules.yml
chmod 777 /home/zht/prometheus/server/rules.yml
vim /home/zht/prometheus/server/prometheus.yml
global:
  scrape_interval:     15s # 默认抓取间隔, 15秒向目标抓取一次数据。
  external_labels:
    monitor: 'codelab-monitor'
# 这里表示抓取对象的配置
scrape_configs:
#这个配置是表示在这个配置内的时间序例,每一条都会自动添加上这个{job_name:"prometheus"}的标签
  - job_name: 'prometheus'
    scrape_interval: 5s #重写了全局抓取间隔时间,由15秒重写成5秒
    static_configs:
      - targets: ['localhost:9090']
docker run --name=prometheus -d \
-p 9090:9090 \
-v /home/zht/prometheus/server/prometheus.yml:/etc/prometheus/prometheus.yml \
-v /home/zht/prometheus/server/rules.yml:/etc/prometheus/rules.yml \
prom/prometheus:v2.7.2 \
--config.file=/etc/prometheus/prometheus.yml \
--web.enable-lifecycle
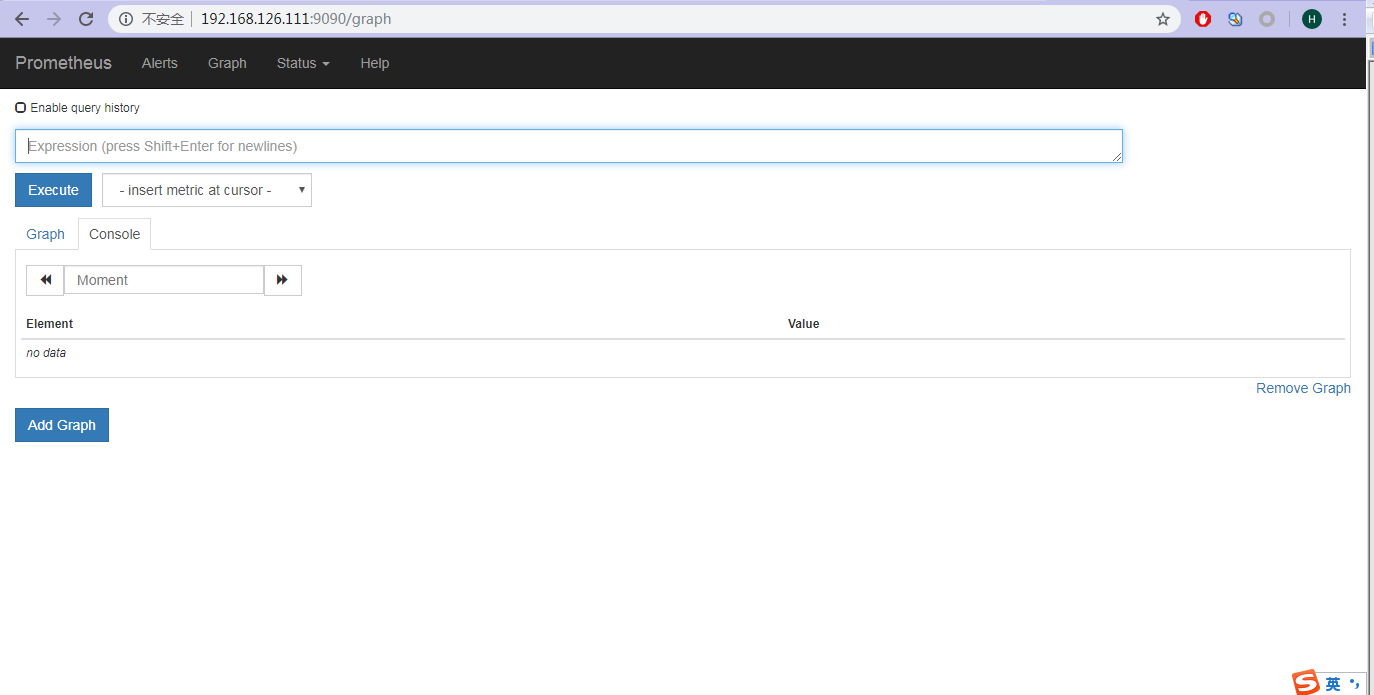
浏览器访问http://192.168.126.111:9090
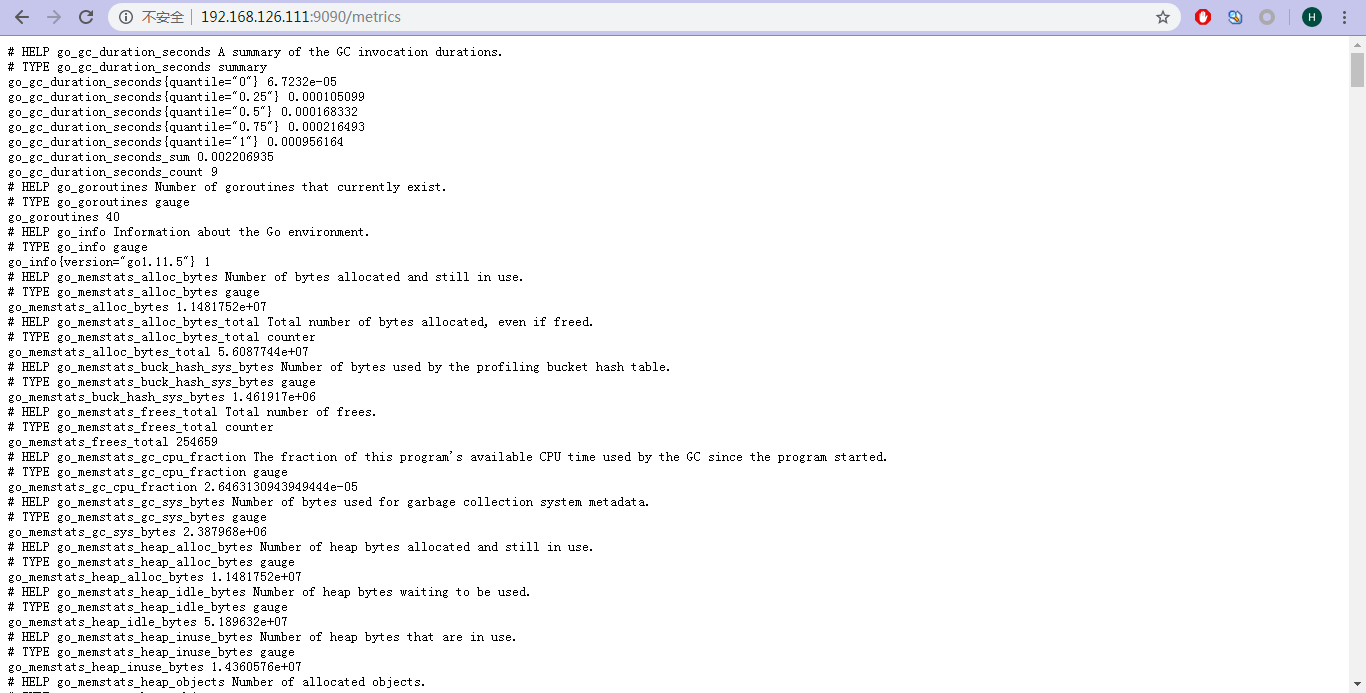
浏览器访问http://192.168.126.111:9090/metrics
安装客户端提供metric接口
1.通过golang客户端提供metrics
mkdir -p /home/zht/prometheus/client/golang/src/
cd /home/zht/prometheus/client/golang/src/
export GOPATH=/home/zht/prometheus/client/golang
git clone https://github.com/prometheus/client_golang.git
#安装需要翻墙的第三方包
mkdir -p $GOPATH/src/golang.org/x/
cd !$
git clone https://github.com/golang/net.git
git clone https://github.com/golang/sys.git
git clone https://github.com/golang/tools.git
#安装必要软件包
go get -u -v github.com/prometheus/client_golang/prometheus
#编译
cd $GOPATH/src/client_golang/examples/random
go build -o random main.go
./random -listen-address=:8080 &
./random -listen-address=:8081 &
./random -listen-address=:8082 &
2.通过node exporter提供metrics
docker run -d \
--name=node-exporter \
-p 9100:9100 \
prom/node-exporter
然后把这两些接口再次配置到prometheus.yml,重新载入配置curl -X POST http://192.168.126.111:9090/-/reload
使用链接方式重新载入配置总是不成功,我一直用的重启Prometheus Server服务
global:
  scrape_interval:     15s # 默认抓取间隔, 15秒向目标抓取一次数据。
  external_labels:
    monitor: 'codelab-monitor'
rule_files:
  #- 'prometheus.rules'
# 这里表示抓取对象的配置
scrape_configs:
#这个配置是表示在这个配置内的时间序例,每一条都会自动添加上这个{job_name:"prometheus"}的标签
  - job_name: 'prometheus'
    scrape_interval: 15s #重写了全局抓取间隔时间,由15秒重写成5秒
    static_configs:
      - targets: ['192.168.126.111:9090']

  - job_name: 'client-golang'
    scrape_interval: 15s #重写了全局抓取间隔时间,由15秒重写成5秒
    static_configs:
      - targets: ['192.168.126.111:8080', '192.168.126.111:8081','192.168.126.111:8082']

  - job_name: 'client-node-exporter'
    scrape_interval: 15s #重写了全局抓取间隔时间,由15秒重写成5秒
    static_configs:
      - targets: ['192.168.126.111:9100']
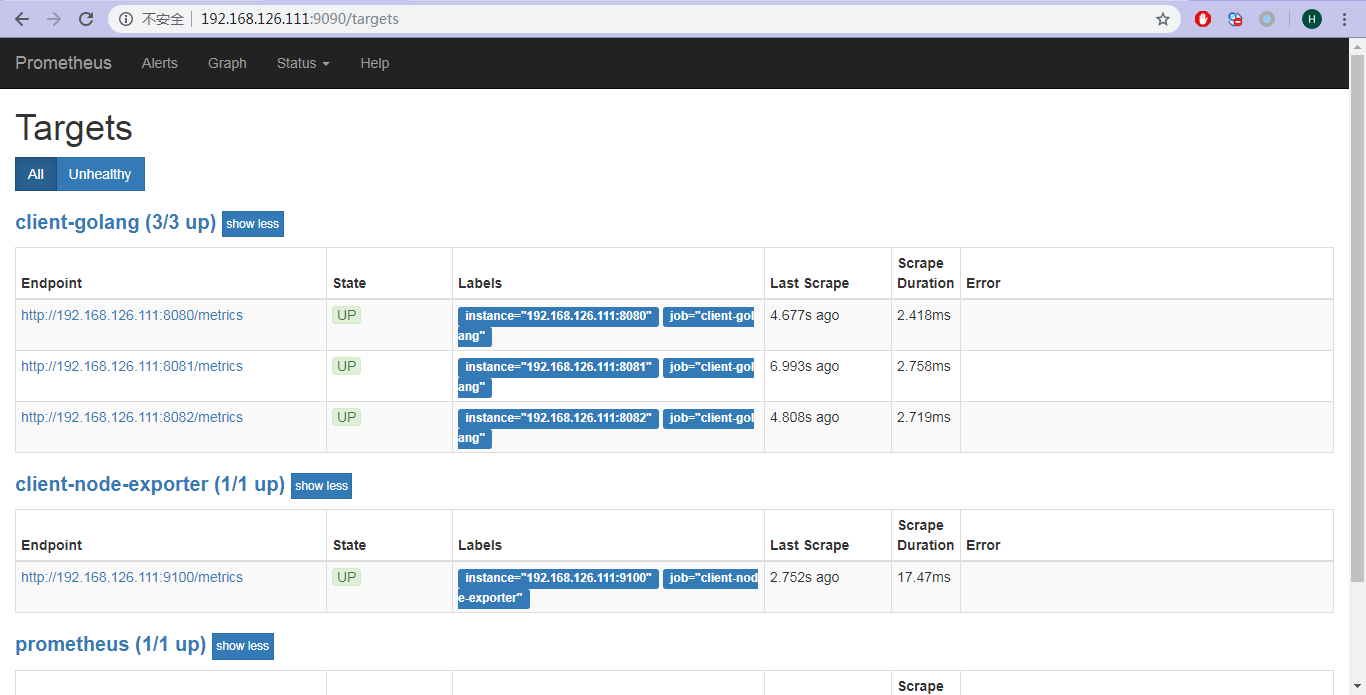
8080,8081,8082这三个端口通过golang客户端提供metrics的服务是启在宿主机上的,9100是通过node exporter启在容器中的,Prometheus server需要访问这四个服务获取metrics,就需要保证他们之间的网络通信正常。
注意:一定要关闭宿主机防火墙
service firewalld stop,否则Prometheus server与各exporter之间的通信会出现异常。
浏览器访问http://192.168.126.111:9090/targets
安装pushgateway
mkdir -p /home/zht/prometheus/pushgateway/
docker run -d -p 9091:9091 --name pushgateway prom/pushgateway
浏览器访问http://192.168.126.111:9091
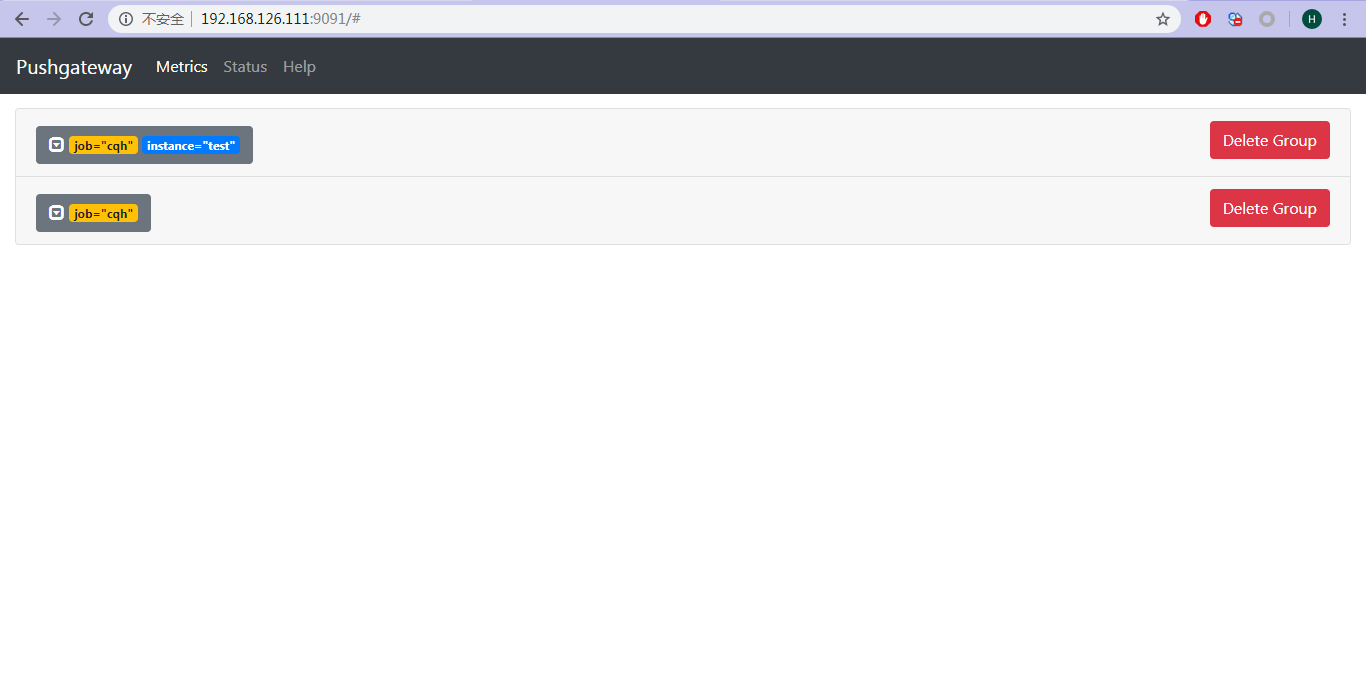
发送数据给Pushgateway
echo "cqh_metric 100" | curl --data-binary @- http://192.168.126.111:9091/metrics/job/cqh
cat <<EOF | curl --data-binary @- http://192.168.126.111:9091/metrics/job/cqh/instance/test
muscle_metric{label="gym"} 8800
bench_press 100
dead_lift 160
deep_squal 160
EOF
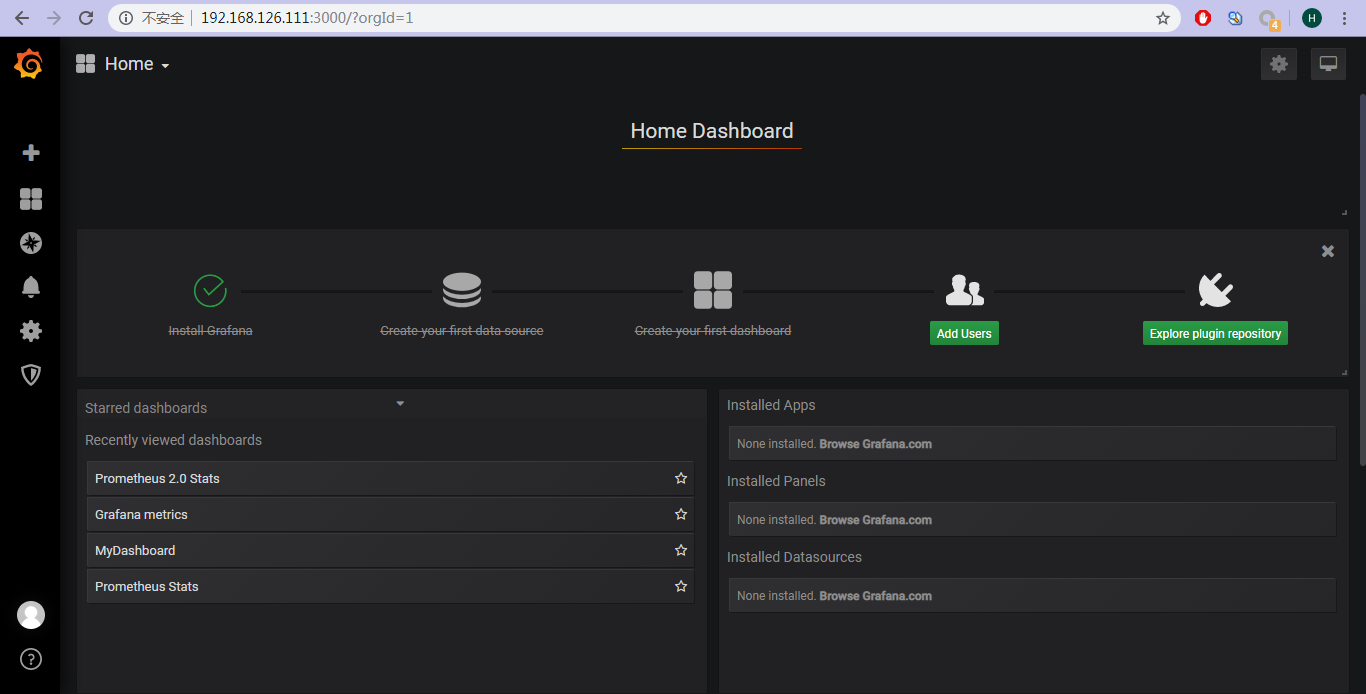
安装Grafana
docker run -d -p 3000:3000 --name grafana grafana/grafana
浏览器访问http://192.168.126.111:3000,默认账号密码为admin / admin
Release包安装Prometheus组件
Docker的网络配置太麻烦了,以下为使用realse包安装Prometheus的过程。
-
安装
screen:
yum install screen
prometheus
wget https://github.com/prometheus/prometheus/releases/download/v2.12.0/prometheus-2.12.0.linux-amd64.tar.gz
tar xzf prometheus-2.12.0.linux-amd64.tar.gz
cd prometheus-2.12.0.linux-amd64
screen -S prometheus
./prometheus --config.file=/home/zht/prometheus/server/prometheus.yml --web.enable-lifecycle
/home/zht/prometheus/server/prometheus.yml文件内容:
global:
  scrape_interval:     15s
  evaluation_interval: 15s
  external_labels:
    monitor: 'codelab-monitor'
rule_files:
  - /home/zht/prometheus/server/rules.yml
scrape_configs:
  - job_name: 'prometheus'
    scrape_interval: 5s
    static_configs:
      - targets: ['192.168.126.111:9090']

  - job_name: 'client-golang'
    scrape_interval: 5s
    static_configs:
      - targets: ['192.168.126.111:8080', '192.168.126.111:8081','192.168.126.111:8082']

  - job_name: 'client-node-exporter'
    scrape_interval: 5s
    static_configs:
      - targets: ['192.168.126.111:9100']

  - job_name: 'pushgateway'
    static_configs:
      - targets: ['192.168.126.111:9091']
        labels:
          instance: pushgateway

  - job_name: 'grafana'
    static_configs:
      - targets: ['192.168.126.111:3000']

alerting:
  alertmanagers:
    - static_configs:
        - targets: ["192.168.126.111:9093"]
/home/zht/prometheus/server/rules.yml文件内容:
groups:
  - name: client-golang
    rules:
    - alert: server_status
      expr: up{job="client-golang"} == 0
      for: 15s
      annotations:
        summary: "机器  挂了"
pushgateway
wget https://github.com/prometheus/pushgateway/releases/download/v0.9.1/pushgateway-0.9.1.linux-amd64.tar.gz
tar xzf pushgateway-0.9.1.linux-amd64.tar.gz
cd pushgateway-0.9.1.linux-amd64
screen -S pushgateway
./pushgateway
alertmanager
wget https://github.com/prometheus/alertmanager/releases/download/v0.19.0/alertmanager-0.19.0.linux-amd64.tar.gz
tar xzf alertmanager-0.19.0.linux-amd64.tar.gz
cd alertmanager-0.19.0.linux-amd64
screen -S alertmanager
./alertmanager --config.file=/home/zht/prometheus/alertmanager/alertmanager.yml --storage.path=/home/zht/prometheus/alertmanager
/home/zht/prometheus/alertmanager/alertmanager.yml文件内容:
global:
  resolve_timeout: 5m
route:
  group_by: ['alertname']
  receiver: 'wechat'

receivers:
- name: 'wechat'
  wechat_configs:
  - corp_id: 'xxxxxxxxxxxxxxxxx'
    to_party: '2'
    agent_id: '1000002'
    api_secret: 'xxxxxxxxxxxxxxxxxxxxxxxxxxxxxxxxxxxxxxxx'
    send_resolved: true
node exporter
wget https://github.com/prometheus/node_exporter/releases/download/v0.18.1/node_exporter-0.18.1.linux-amd64.tar.gz
tar xzf node_exporter-0.18.1.linux-amd64.tar.gz
cd node_exporter-0.18.1.linux-amd64
screen -S node_exporter
./node_exporter
共起了5个screen:Prometheus Server,PushGateway,AlertManager,Node Exporter,Client Test
[root@zht-prometheus prometheus]# screen -ls
There are screens on:
	5474.pushgateway	(Detached)
	4019.alertmanager	(Detached)
	3954.prometheus	(Detached)
	3889.client_golang	(Detached)
	3430.node_exporter	(Detached)
5 Sockets in /var/run/screen/S-root.
配置企业微信接收告警信息
企业微信的申请与配置
- 微信企业号申请地址:https://work.weixin.qq.com/
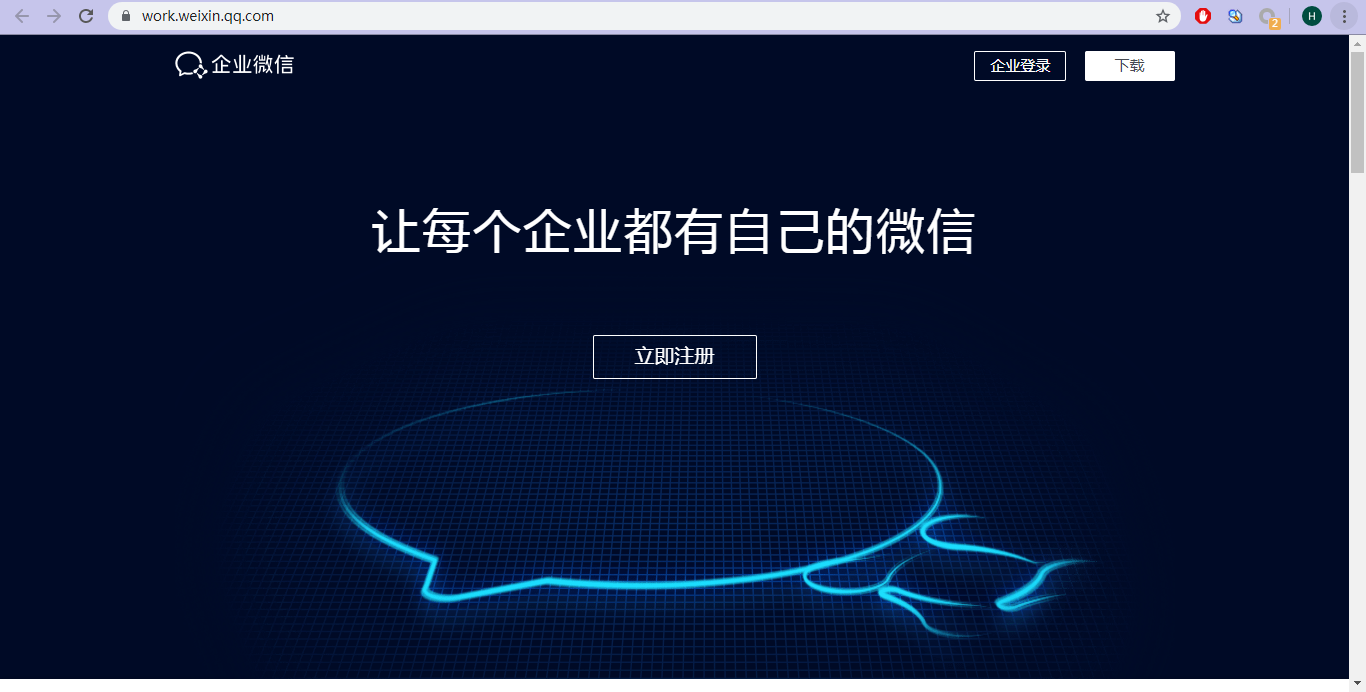
安装要求填写基本信息,截止本文发布时申请流程不复杂,无需审核。
- 创建应用
应用管理->自建->创建应用
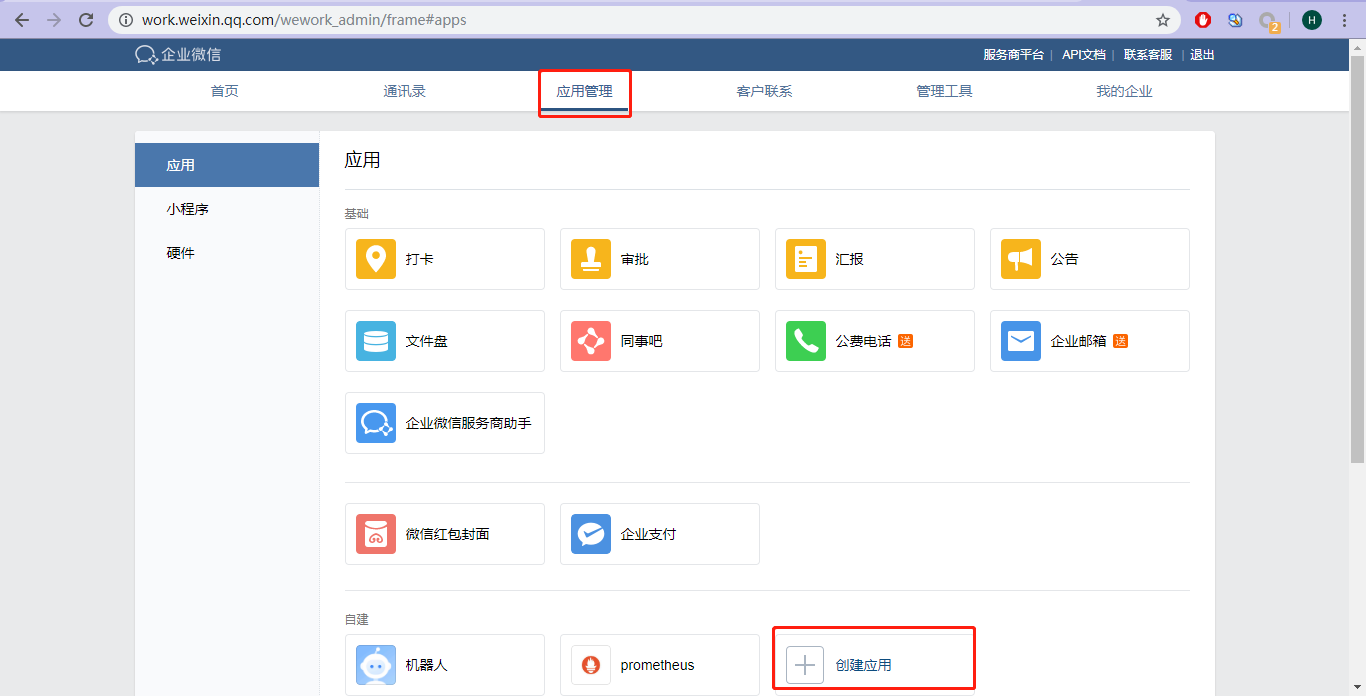
查看应用信息
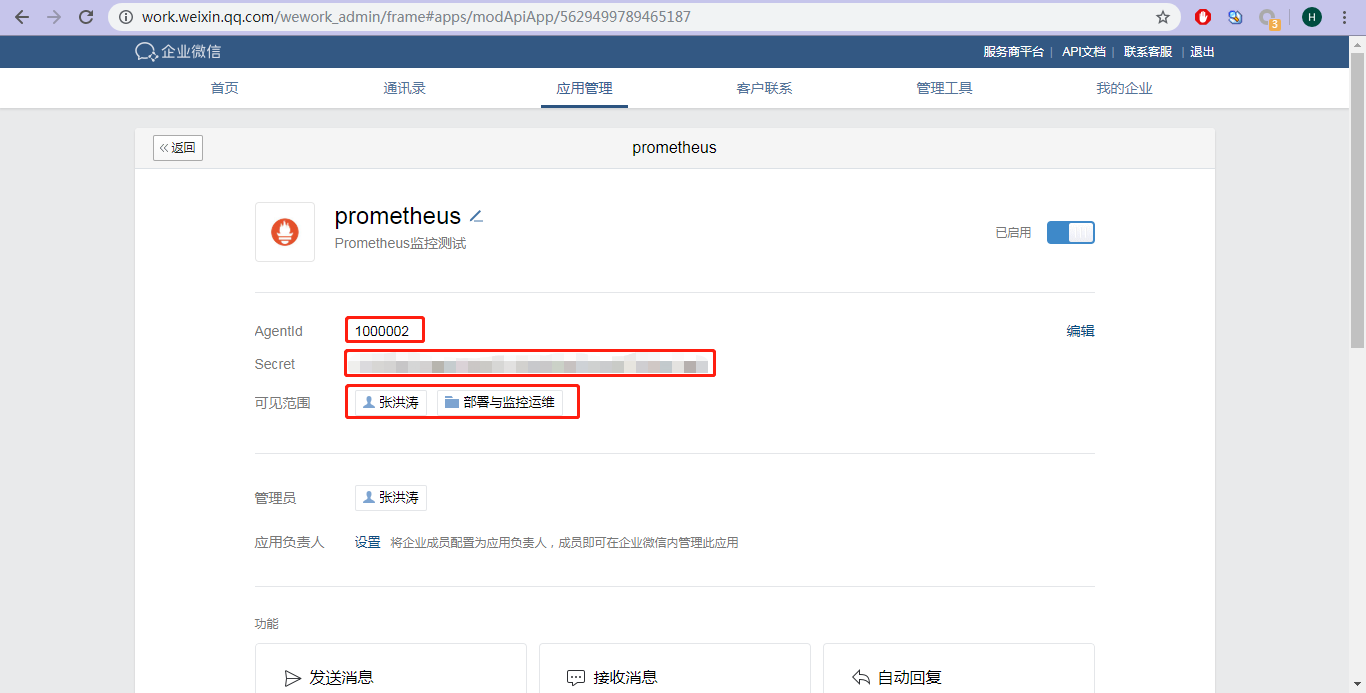
AgentId对应alertmanager的receivers配置中的agent_id
Secret对应alertmanager的receivers配置中的api_secret
可见范围对应alertmanager的receivers配置中的to_party
to_party这个地方有坑,如果创建的应用对发送的部门或个人不可见,告警信息将发送失败,且没有失败信息
查看企业信息,我的企业->企业信息
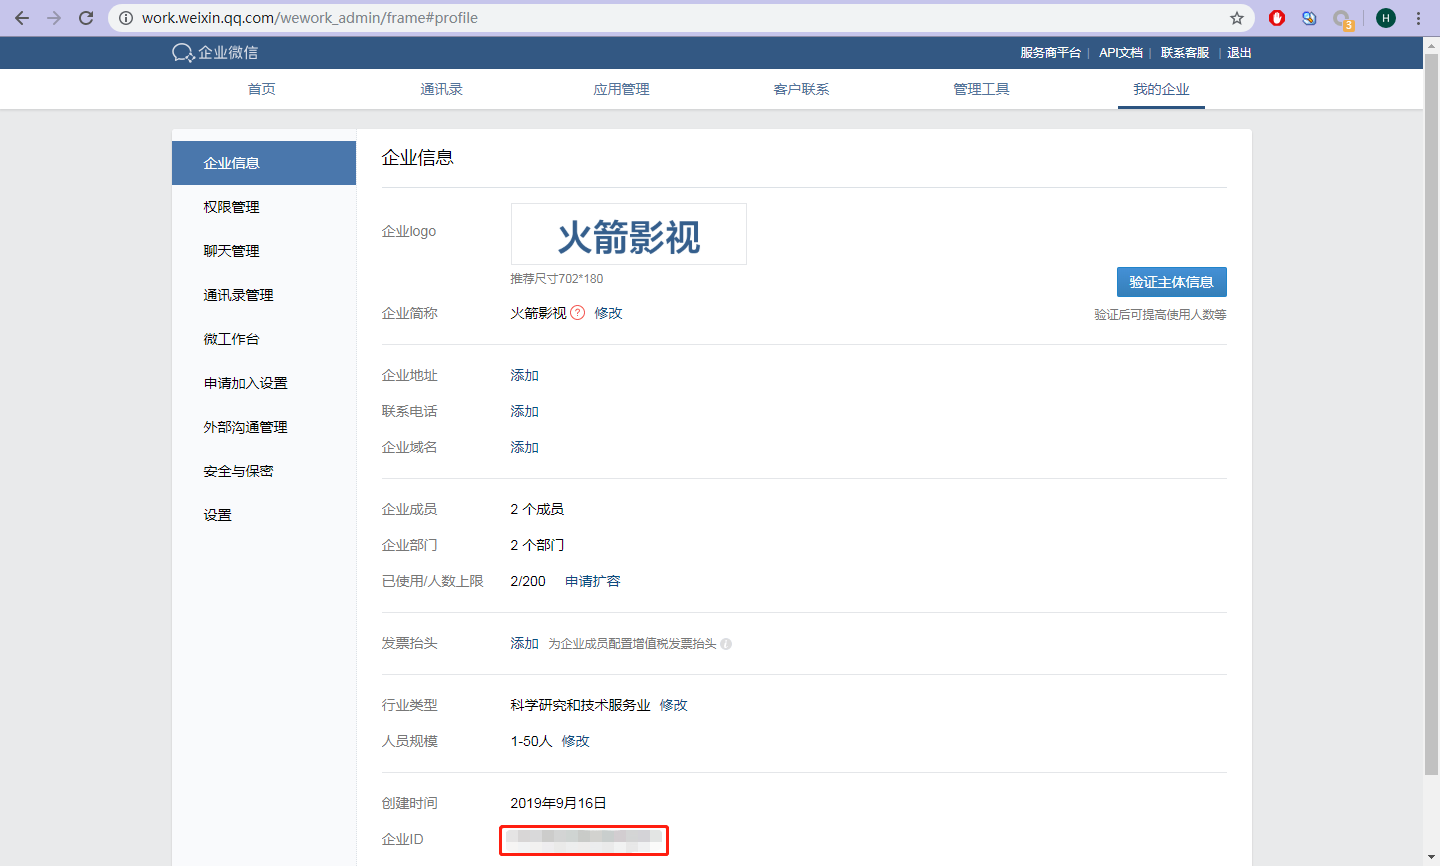
企业ID对应alertmanager的receivers配置中的corp_id
配置alertmanager的receivers
/home/zht/prometheus/alertmanager/alertmanager.yml文件中的内容在上面章节已经贴出,本节略
调试企业微信应用API
如果出现企业微信收不到告警信息,可以通过访问企业微信API方式调试发送告警消息。企业微信相关概念说明请参考企业微信API说明。
- 获取API的access_token
请求方式:GET(HTTPS)
请求URL:https://qyapi.weixin.qq.com/cgi-bin/gettoken?corpid=ID&corpsecret=SECRET
corpid为企业ID,corpsecret为应用Secret,通过本API获取access_token
- 发送测试消息
请求方式:POST(HTTPS)
请求地址: https://qyapi.weixin.qq.com/cgi-bin/message/send?access_token=ACCESS_TOKEN
access_token为上一个API请求返回结果中的access_token
请求body体示例:
{
   "toparty" : "2",
   "msgtype" : "text",
   "agentid" : 1000002,
   "text" : {
       "content" : "测试企业微信应用消息发送"
   },
   "safe":0
}
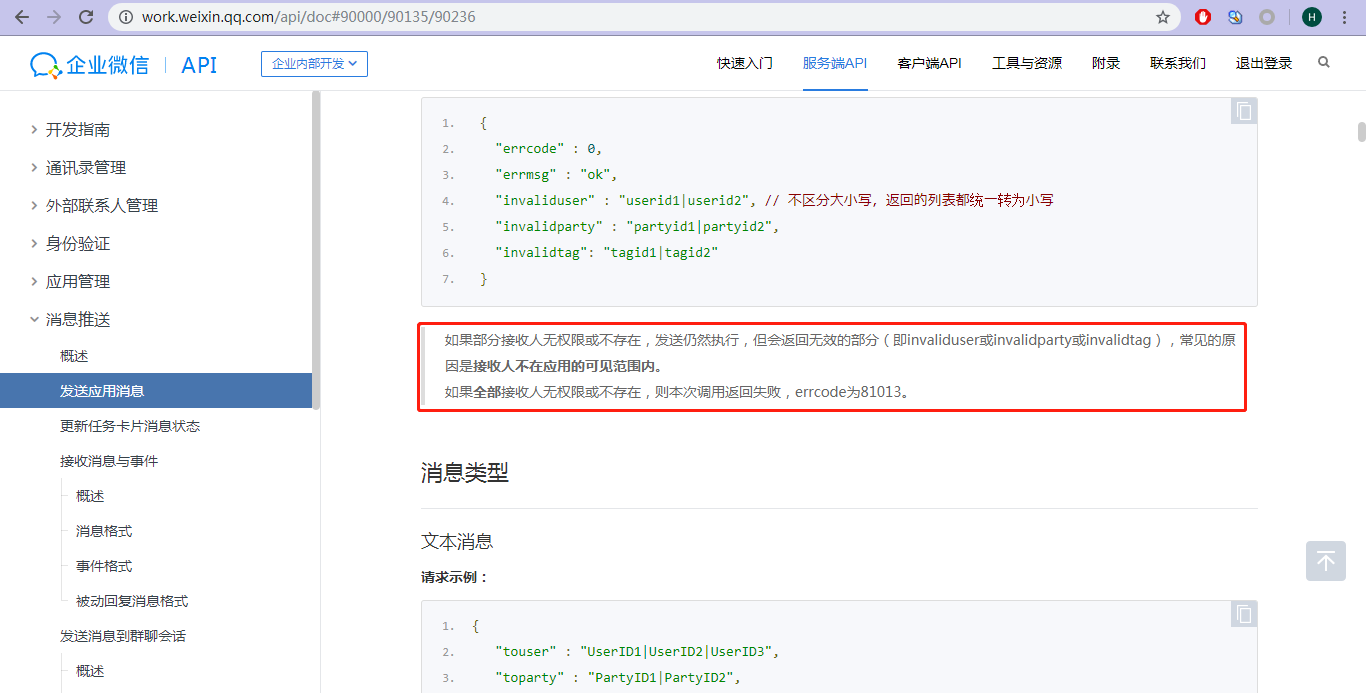
如果请求范围错误,可根据errcode在企业微信官网指导中查询错误原因,例如:
{
    "errcode": 81013,
    "errmsg": "user & party & tag all invalid, hint: [1568723194_35_5ab506fd816d2edfe1a6668d2d6d44d2], from ip: 61.183.207.98, more info at https://open.work.weixin.qq.com/devtool/query?e=81013"
}